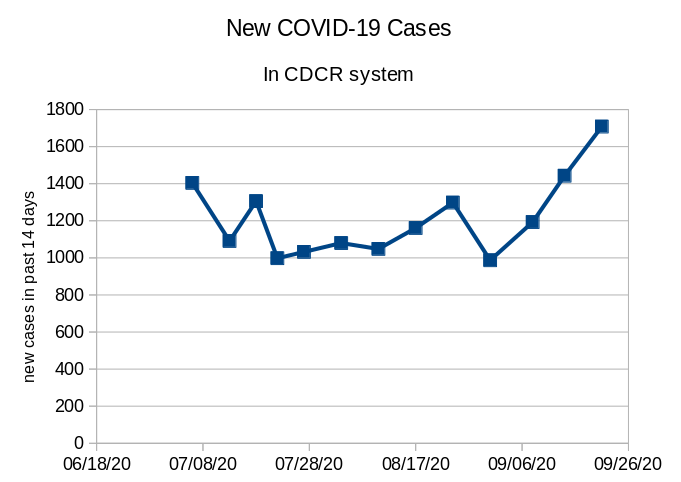
To read CDCR’s response briefs in the Marin cases and in Von Staich, you could think that the pandemic is dwindling in prison. The opposite is true: the last two weeks have seen a spike in new COVID-19 cases in CDCR. The graph above is based on the daily CDCR data (Chad Goerzen and I code them daily.)
Here are a few other things we’ve learned:
- Overall number of cases since the beginning of the pandemic stands now at 13,155 – nearly 14% of the total institution population, which as of Wednesday of last week was 95,886. This is a bit misleading, as some of the people who became infected have been released. But even with the higher population before the releases, this is a shocking percentage. By comparison, the rate of all-time infections for the entire state is 2009 per 100,000 people (approximately 2%). People in prison have been seven times as likely as people in the state to contract COVID.
- COVID-19 is more lethal in prison than outside prison. Statewide, we’ve had 38 deaths per 100,000 people; in CDCR, more than twice that: 60 deaths for slightly less than 100,000 people. And this is before adjusting for age.
- If you look only at the new spike in cases in the last 14 days, infection rates are even worse in prison. In CDCR facilities, it’s 17.6 per 1,000 people; in CA, it’s 1.3 per 1,000. For reference, at its peak, the CA infection rate was 3.3 per 1,000.
- Generally speaking: My mentor and friend Malcolm Feeley made a shocking rough calculation. If we totaled up the population in archipelago of America’s prisons and considered them a country, both the number and rate of COVID-19 infections and deaths would place this “prison country” in the top twenty five percent of all countries in the world in terms of both absolute number of cases and deaths, and rate of deaths. By Malcolm’s rough count, this would put the “prison country” at around number 53 in over 200 countries.
We’ve also learned where the worst new outbreaks are:
- FSP (Sacramento) – 585 new cases in 14 days
- ASP (Kings) – 260 new cases in 14 days
- CRC (Riverside) – 269 new cases in 14 days
- CVSP (Riverside) – 182 new cases in 14 days
- SATF (Kings) – 148 new cases in 14 days
- VSP (Madera) – 77 new cases in 14 days
As you can see, this clusters mostly around Kings and Riverside Counties, which are, respectively, #2 and #14 in new cases per the L.A. Times counter (whether there’s a correlation, and what the timing is like, is a complicated question.) The biggest spike in new cases is in Imperial county; we should note that Riverside County prisons are located almost on the border with Imperial county.
This trend is more generalizable. Here’s a snapshot of our coded data, in order of outbreak seriousness in counties. You’ll see a correlation, to the tune of 0.588 (pretty good!) between outbreak in the county and an outbreak at a prison located either in the county or in a neighboring county near the county border.

As I’ve explained before, we’re not telling an airtight causal story here. All we are doing is dispelling the notion that locking people up is somehow keeping the surrounding county safe.


No comment yet, add your voice below!