Today’s Chronicle features a great article by Bob Egelko, which tries to parse out who is responsible for the San Quentin catastrophe. Getting into the chain of command that made the botched transfer decision might come in handy at a later date, I think, when the time comes to file the inevitable (and more than justified) lawsuit. But, as I said in the article, the time to squabble over who’s at fault has not come yet. Right now we must have all hands on deck, including Gov. Newsom, Mr. Kelso, and Mr. Diaz, making prison releases their absolute top priority.
By now, regular readers of my COVID-19 prison crisis posts know that Gov. Newsom’s plan to release a mere 8,000 people over the course of the summer will not suffice to curb infections, illnesses, and death in prison. You also know that, at least with regard to San Quentin–an antiquated facility that lacks proper ventilation–the physicians at AMEND recommended an immediate population reduction by 50%. But how is it to be done?
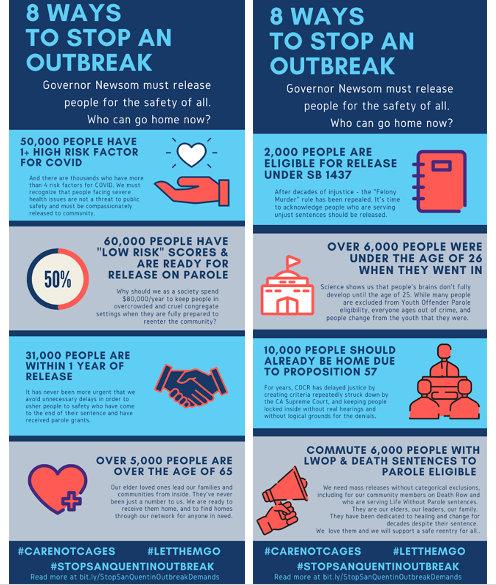
The #StopSanQuentinOutbreak coalition, and the Prison Advocacy Network (PAN) have useful, well-researched answers, which are encapsulated in the lovely infographic above. Here are the coalition’s demands, and here’s the PAN page offering legal resources and pathways to release. I want to spend this post getting into the particulars. Before doing so, though, I need to explain a few important things.The Prisoner Advocacy Network has a list of pathways to release.
A lot of the categories in Newsom’s current release plan make sense and show evidence of public health thinking. They are considering age, medical condition, and time left on people’s sentences. The problem with the categories is that they are unnecessarily restrictive, and I think the restrictions can be attributed to two hangups that many people, including well-meaning, educated folks, share about prison releases: the fear that releasing a lot of people is going to be hugely expensive and the hangup around the violent/nonviolent distinction. So let’s tackle these two first.
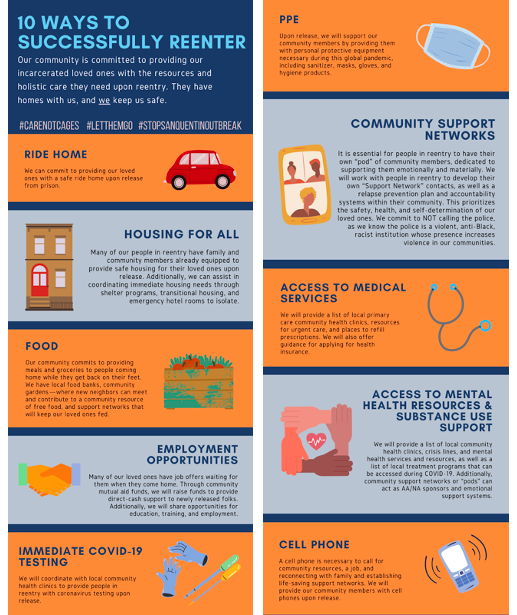
Get over the hangup of re-entry costs. You may have read that BSCC is considering offering $15 million to CDCR, and might wonder how we can possibly pay for housing, temporary or permanent, of tens of thousands of people. Of course this is going to cost money; the question is, compared to what. It may shock you to learn that, in the 2018/2019 fiscal year, the Legislative Analyst’s Office estimated that the average cost to incarcerate one person in California for a year was $81,502 – more than a $30k increase since our recession-era prison population reduction in 2010-2011. How much does it cost to help such a person for a year, when their healthcare is funded by Obamacare, rather than by CDCR? Here’s a PPIC report from 2015 detailing alternatives to incarceration. Specifically with regard to COVID-19-related reentries, here’s another great infographic detailing what the needs are going to be. The big one is housing, and there are organizations on the ground that are set up to help with that. Even with transitional housing costs, this does not add up to $80k per person per year.

Get over the hangup of making the violent/nonviolent distinction. I am still seeing lots of well-intentioned folks who read Michelle Alexander years ago tweeting about how ending the war on drugs (with or without the hashtag), or focusing on so-called “nonviolent inmates” is the key to fighting this outbreak. I can’t really fault them for this misapprehension–what I can do is repeatedly present you with facts to correct it.
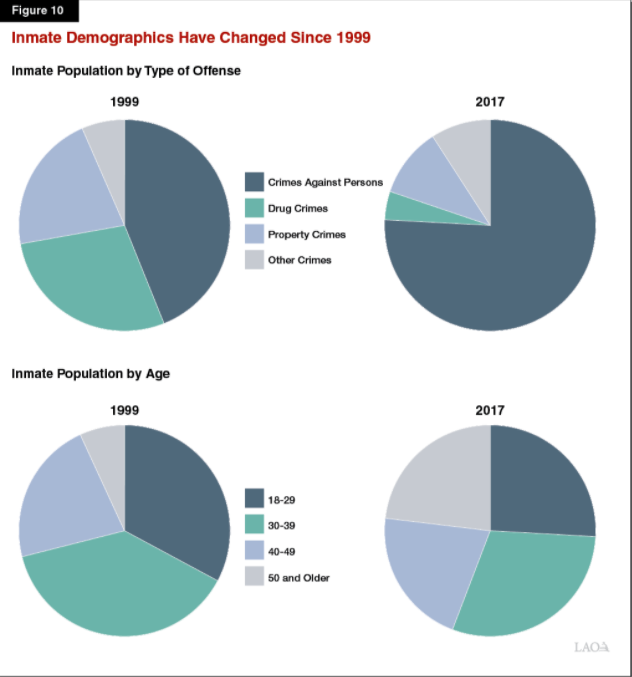
Take a look at the graph below. It comes from CDCR’s population data points from 2018. You will note that the vast majority of people in California prisons are serving time for a violent offense. Drug convictions are the smallest contributors to our prison population (this is of course not true for jails or for federal prisons; I’m talking about the state prison system.) I know we all love to say “dismantle” these days, but dismantling the war on drugs will do very little to reduce state prison population.

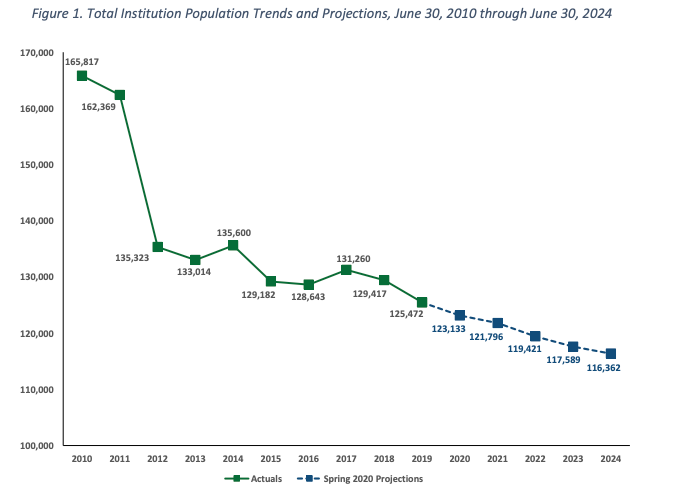
Now, take a look at CDCR’s Spring 2020 population projection. What you see in the diagram below are the reductions in population since 2010, and some projections for the years to come. The two big reductions were in 2011, following the Realignment, and, to a smaller extent, in 2015, following Prop. 47. Both of those propositions diverted drug offenders to the community corrections systems–jails and probation. If you care about the injustices of the war on drugs, your heart is in the right place, but this is simply not the most dire problem we are facing in the context of prison population reduction.

It is easier to talk about drugs and nonviolent offenders, because these are typically categories of people that evoke more sympathy from the press. My colleague Susan Turner at UCI has shown that risk assessment tools, when used properly and carefully, yield dependable predictive results, and these are not correlated with the crime of commitment. Because we were so married to the idea that only nonviolent folks need help and public support, our three major population reduction efforts–Realignment, Prop 47, and Prop 57–missed the mark on getting more reductions for little to no “price” of increased criminal activity. Whenever you see a headline lambasting the Governor or the Board of Parole Hearings for releasing a “murderer,” immediately ask yourself the two relevant questions: (1) How old is this person now, and (2) how long ago did they commit the crime? The answers should lead you to the robust insights of life course criminology: People age out of violent crime by their mid- to late-twenties, and at 50 they pose a negligible risk to public safety. Moreover, what a person was convicted of doesn’t tell you a full story of what their undetected criminal activity was like before they were incarcerated. Take a look at the homicide solving rates in California, as reported by the Orange County Register in 2017–a bit over 50%–and ask yourself whether the crime of conviction is telling you a story with any statistical meaning.

In short, my friend, take a breath, let go of your attachment to the violent/nonviolent distinction, and let’s find some real solutions. The #StopSanQuentin coalition has a more in-depth breakdown to offer. Generally speaking, the legal mechanisms to achieve this reduction were identified by UnCommon Law in their letter to the Governor–primarily, early releases, commutations, and parole. Section 8 of Article V of the CA Constitution vests the power to grant a “reprieve, pardon, or commutation” in the Governor. The Penal Code elaborates and explains the process. Section 8658 of the California Government Code provides an emergency release valve: “In any case in which an emergency endangering the lives of inmates of a state, county, or city penal or correctional institution has occurred or is imminent, the person in charge of the institution may remove the inmates from the institution. He shall, if possible, remove them to a safe and convenient place and there confine them as long as may be necessary to avoid the danger, or, if that is not possible, may release them. the Governor has the authority to grant mass clemencies in an emergency.”
To begin, there are some bulk populations which, if targeted for release, can deliver the kind of numbers we need to stop the epidemic. These three populations largely overlap, which might make it easier to tailor the remedies to capture the right people. About half of the CDCR population are people designated “low risk” by CDCR’s own admission. CDCR uses risk classification primarily for housing purposes, and their methodology–as well as their practice of overriding their own classification–have been found by LAO to be in dire need of overhaul. LAO and other researchers believe that CDCR’s use of the “low risk” category is too restrictive, and their exceptions to their own classification come from hangups around issues of crime of commitment. This chart from the LAO report tells a useful story: Most of our prison population is doing time for violent crime, and a quarter of it is 50 and older; given the length of sentences for violent crimes, and the fact that a quarter of CA prisoners is serving decades on one of the “extreme punishment trifecta” of sentences (death, LWOP, or life with parole), it’s not difficult to figure out where the older, lower risk people fit in.

Between a quarter to a third of the prison population, depends on how you count: People who have already served a long sentence. This is the time to question the marginal utility of serving a few more years after being in prison for decades. According to the Public Policy Institute of California, About 33,000 inmates are “second strikers,” about 9,000 of whom are released annually after serving about 3.5 years. Another 7,000 are “third strikers,” fewer than 100 of whom are released annually after serving about 17 years. Approximately 33,000 inmates are serving sentences of life or life without parole. Fewer than 1,000 of these inmates are released every year, typically after spending two or more decades behind bars.
23%: People Over 50. Not only does this population intersect with lower criminal risk and higher medical risk, it also correlated with cost. According to the Public Policy Institute of California and Pew center data they cite, in fiscal year 2015 the state spent $19,796 per inmate on health care–more than thrice the national average.
To this, we can add a few smaller populations, numbering a few thousand each. Let’s start with people on death row and people on life without parole, who have been exempted from pretty much any release valve possible. The Governor has the authority to commute both of those sentences to life with parole today, and this is probably the right course of action anyway, pandemic or no pandemic. We have a moratorium on the death penalty, which means no one is getting executed but we are still paying for expensive capital punishment litigation. Cut out the middle man and shift all these folks to life with parole. I talk about how these three sentences are indistinguishable anyway in Yesterday’s Monsters, chapter 2.
There are also, apparently, a few hundred people still incarcerated who have been recommended for parole and approved by the Governor–coalition members have identified a few dozen in San Quentin alone. If these people have been given the green light to be released, why are they still behind bars? As for people who have been recommended for release and still awaiting the Governor’s authorization, now’s the time to expedite that.
Finally, lifting the offense limitations on people from outbreak epicenters, people with medical conditions, and the like, should expand those numbers considerably, given the significant overlap between crime of commitment, length of sentence, age, and health condition.
My point is that all of this is eminently doable, and there would hardly be any downsides. If we can just let go of the tendency to view only one side of the cost equation, and of our hangup about the nonviolent/violent distinction, we can scale up the proposed release plan to the point that it will be effective. Let me end with this thought: Gov. Newsom announced that the goal is to reduce San Quentin population to close to 100% of design capacity. In a sane world, prisons that are at 100% occupancy are not a goal. They are a starting point.
August 14 Update: Jason Fagone has a gorgeous piece in today’s Chron explaining how we could achieve a 50% reduction today, with negligible impact on public safety.


